


Vegetation Sensitivity Index: Key to Climate Change Insights
 March 28, 2025
The Vegetation Sensitivity Index (VSI) is an innovative tool developed by researchers to tackle the pressing environmental risks posed by climate change. This index utilizes satellite data to identify vulnerable locations on Earth that are most at risk due to changing conditions. By mapping areas that show heightened sensitivity to temperature variations, the VSI highlights ecosystems that may be disproportionately impacted by climatic shifts. The insights derived from the VSI are crucial for understanding how different regions will respond to ongoing environmental challenges. As we face growing threats to biodiversity, the VSI stands out as a beacon of hope, guiding efforts to protect these critical habitats.
Often referred to as the ecological vulnerability index, the Vegetation Sensitivity Index serves as a vital instrument in assessing the responsiveness of plant life to climatic fluctuations. This analysis leverages satellite imagery to indicate locations that may experience significant alterations in vegetation cover due to environmental stresses. By examining the impact of various climatic factors such as temperature changes, water shortages, and cloud cover on plant resilience, researchers can better predict the consequences of climate shifts. Understanding these dynamics is essential for identifying regions that require immediate conservation efforts and for developing strategies to mitigate climate-related risks. As climate patterns continue to evolve, methodologies like the ecological vulnerability index become increasingly important for safeguarding our planet’s diverse ecosystems.
Understanding the Vegetation Sensitivity Index (VSI)
The Vegetation Sensitivity Index (VSI) is an innovative approach developed by researchers to assess the impact of climate change on various ecosystems. By utilizing satellite-derived data, the VSI provides a comprehensive overview of vegetation health and sensitivity across different regions. Unlike traditional methods that may generalize over large areas, the VSI focuses on specific ecosystems, allowing scientists to identify which locations are most vulnerable to environmental changes. This targeted approach is essential for developing effective conservation strategies to mitigate the risks posed by climate change.
The creation of the VSI involves sophisticated satellite technology, such as the Moderate Resolution Imaging Spectroradiometer (MODIS), which captures high-resolution images of the Earth’s surface. These images are analyzed to determine factors like plant cover, temperature variations, and moisture levels. By mapping these variables, researchers can illustrate how climate change is affecting different landscapes, and this can highlight critical areas where conservation efforts are urgently needed. Ultimately, the VSI serves as a vital tool for scientists and policymakers alike, guiding them in addressing climate-related challenges.
Impact of Climate Change on Biodiversity and Ecosystems
Climate change poses significant threats to biodiversity around the globe. As temperatures rise and weather patterns become more erratic, various ecosystems are being pushed to their limits. For example, sensitive regions like the Arctic tundra and tropical rainforests are experiencing accelerated changes that threaten their unique flora and fauna. The VSI provides essential insights into these dynamics by illustrating which areas are particularly susceptible to disruptions caused by environmental risks such as extreme temperature variations and drought.
In response to these challenges, conservationists are using data from the VSI to prioritize interventions in the most vulnerable locations. This focused approach allows for targeted efforts that can effectively address the specific needs of each ecosystem. By understanding where and how climate change is likely to impact biodiversity, strategies can be developed to bolster resilience, such as restoring natural habitats, protecting endangered species, and implementing sustainable land-use practices.
Frequently Asked Questions
What is the Vegetation Sensitivity Index and how does it relate to climate change?
The Vegetation Sensitivity Index (VSI) is a crucial analytical tool developed to identify the impacts of climate change on plant cover around the globe. By utilizing satellite-derived data, the VSI reveals how different ecosystems respond to environmental risks, showcasing which locations are most vulnerable to climate variability.
How is satellite data used to create the Vegetation Sensitivity Index map?
Researchers employ moderate-resolution imaging spectroradiometer technology to gather satellite data, which forms the basis of the Vegetation Sensitivity Index map. This advanced mapping technique highlights areas affected by climate change and predicts future vegetation responses based on temperature variations, cloud cover, and moisture availability.
Which regions of the world are most vulnerable according to the Vegetation Sensitivity Index?
The Vegetation Sensitivity Index identifies several ecologically sensitive regions at risk from climate change, including the Arctic tundra, boreal forests, tropical rainforests, and alpine zones. These locations exhibit significant responses to climate impacts, demonstrating lower resilience to environmental risks.
How does the Vegetation Sensitivity Index help in predicting future climate-related changes?
The VSI is designed to forecast crucial climate indicators such as temperature changes and moisture levels, enabling researchers to understand and anticipate future environmental shifts. By analyzing satellite data, the Vegetation Sensitivity Index serves as a vital resource for predicting changes in water availability and rainfall patterns due to climate change.
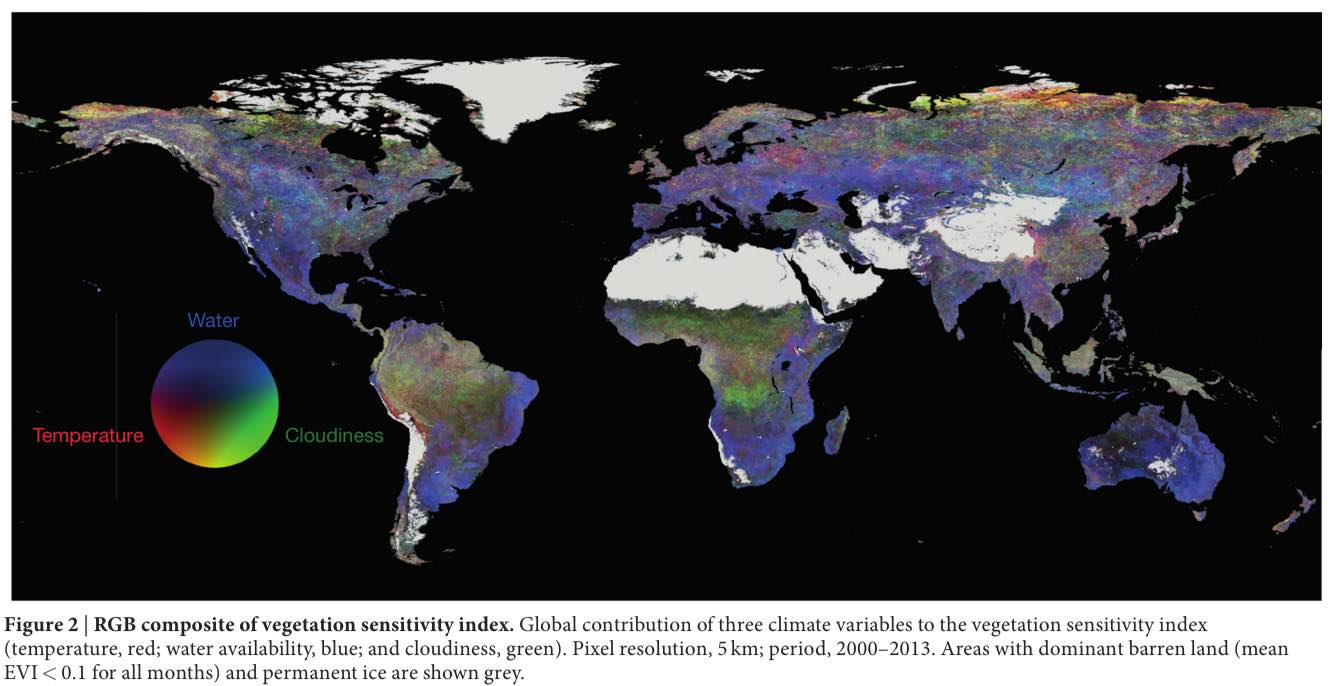
What does the color scheme on the Vegetation Sensitivity Index map signify?
The Vegetation Sensitivity Index map utilizes a color scheme to indicate the influence of climate change variables: grey represents barren land and permanent ice, red signifies temperature impacts, blue indicates water availability, and green reflects cloudiness effects. This visual representation helps in identifying vulnerable locations across the globe.
Why is the Vegetation Sensitivity Index considered important for environmental research?
The Vegetation Sensitivity Index is critical for environmental research as it highlights regions that are likely to experience severe impacts from climate change. By employing satellite data, it allows scientists to understand and prioritize areas needing intervention, thereby contributing to better management and mitigation strategies for vulnerable ecosystems.
| Key Point | Description |
|---|---|
| Vegetation Sensitivity Index (VSI) | A map developed to identify climate change risks and vulnerable locations globally. |
| Purpose of VSI | To highlight regions that require attention due to varying climate impacts on different ecosystems. |
| Research Methods | Utilizes satellite-derived data and moderate-resolution imaging spectroradiometer technology. |
| Climate Variables’ Impact | Indicated by color coding: Red for Temperature, Blue for Water availability, Green for Cloudiness. |
| Identified Sensitive Regions | Includes Arctic tundra, boreal forests, tropical rainforests, and more. |
| Resilience Factors | Regions marked as having lower resilience and high probability of change due to climate variability. |
Summary
The vegetation sensitivity index (VSI) offers crucial insights into the effects of climate change across various ecosystems by identifying regions that are particularly vulnerable. This innovative mapping technique, utilizing satellite data, underscores the need for targeted conservation efforts as different habitats face unique challenges. Understanding these dynamics is essential for developing effective strategies to mitigate the impacts of climate change on our planet’s biodiversity and resource availability.